Native IESVE integration: run it from VE Python Scripts in Navigator. It reads APS and automatically links weather data, with no CSV export or manual parameters required.
IESVE VE SCRIPTS TOOL · US$5
Turn wind in a weather file into a wind rose you can read, compare and export.
This is a VE Scripts wind rose tool for IESVE. Run it inside VE and it can link weather data automatically through APS, helping you study wind direction, wind speed and calm conditions for a year, a season or a defined period.
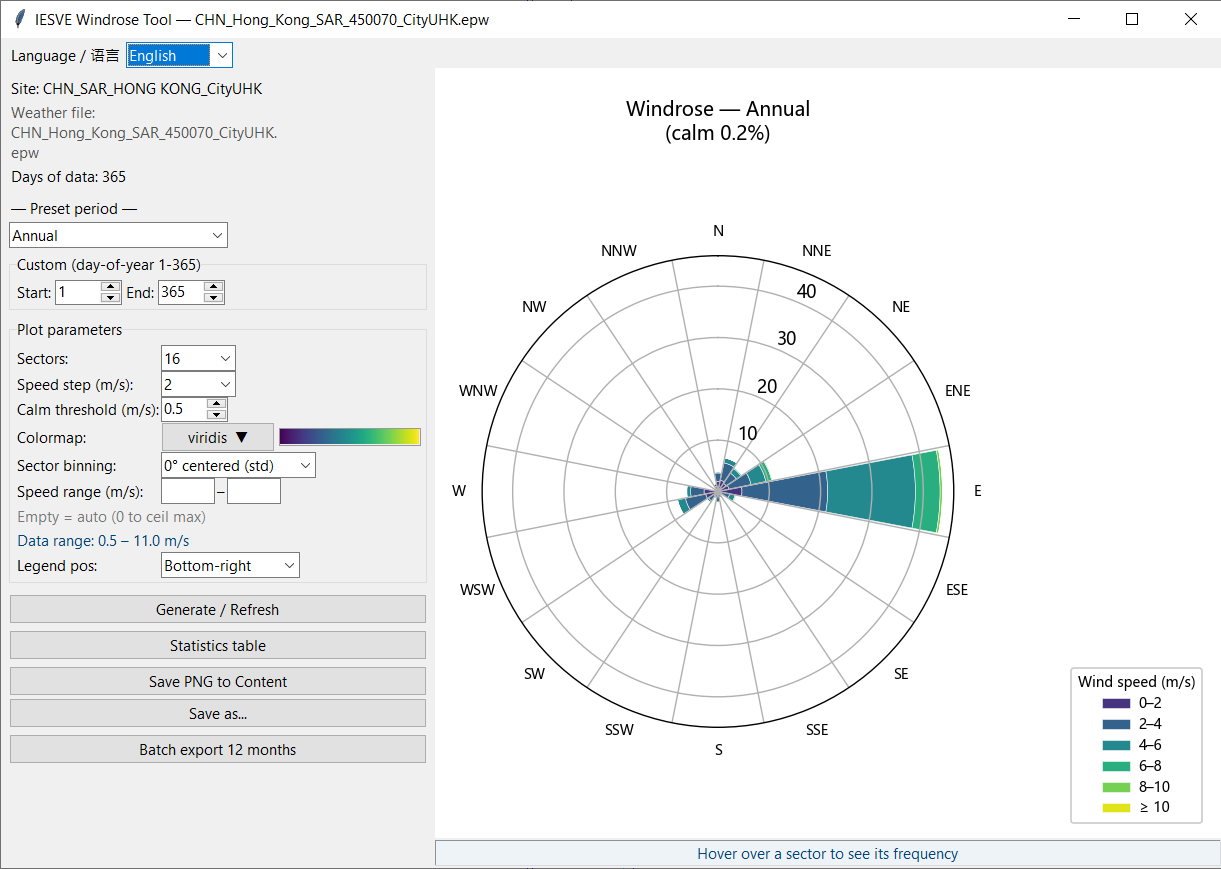
Tool interface: weather-station details, annual preset, chart settings and a wind rose stacked by wind-speed band.
FROM APS TO EVIDENCE
When a project needs to discuss wind, start by making the data clear.
A wind rose combines the frequency of wind from each direction with wind-speed bands in a single graphic. It is a more direct way to frame climate context, early design decisions or a project presentation than reading raw weather data row by row.
IESVE 2025IESVE 2024IESVE 2023
Delivery is a .vep package matched to your IESVE release. IESVE software and licences are not included.
WHAT THE TOOL DOES
Set the analysis, interact with the chart and export a clear result.
The functions below reflect the actual tool interface and the included examples.
Use a full-year preset or custom start and end days to study a season or another defined period from the same weather file.
Choose 8, 12, 16 or 36 direction sectors; customise wind-speed increments and set the calm threshold from 0.0 to 3.0 m/s.
Use matplotlib colour maps and stacked wind-speed bands. Drag the legend anywhere on the chart and release it to keep the chosen position.
Hover over any sector to see its name, angle range, frequency and equivalent hours, without opening a separate spreadsheet.
Review sector-frequency tables as hours only, frequency only or both, then export Excel-compatible CSV statistics.
Save PNG charts or batch-export a 12-month PDF in 4×3 landscape or 3×4 portrait layouts with consistent bands, colours and legend.
Switch the interface between Chinese and English. Separate packages support IESVE 2023, 2024 and 2025.
INSTALL IN ABOUT 30 SECONDS
Install the matching .vep package, then run it from VE Navigator.
Separate packages are supplied for VE 2023, 2024 and 2025. Confirm your software year first to avoid installing an incompatible package.
- 01
After receiving the delivery email, download the matching windrose_tool_VE20XX.vep file.
- 02
In IESVE, open Tools → Manage Scripts.
- 03
Select Install, then choose the matching .vep package.
- 04
In Navigator → VE Python Scripts, find Windrose Tool and run it.
SEE THE OUTPUTS
More than one chart: inspect settings, statistics and monthly outputs.
01 · GENERATE
Set the period and chart parameters
Choose a full year or custom date range, then set sectors, wind-speed bands, calm threshold, colours and legend presentation. After plotting, the legend can be dragged to the best position.
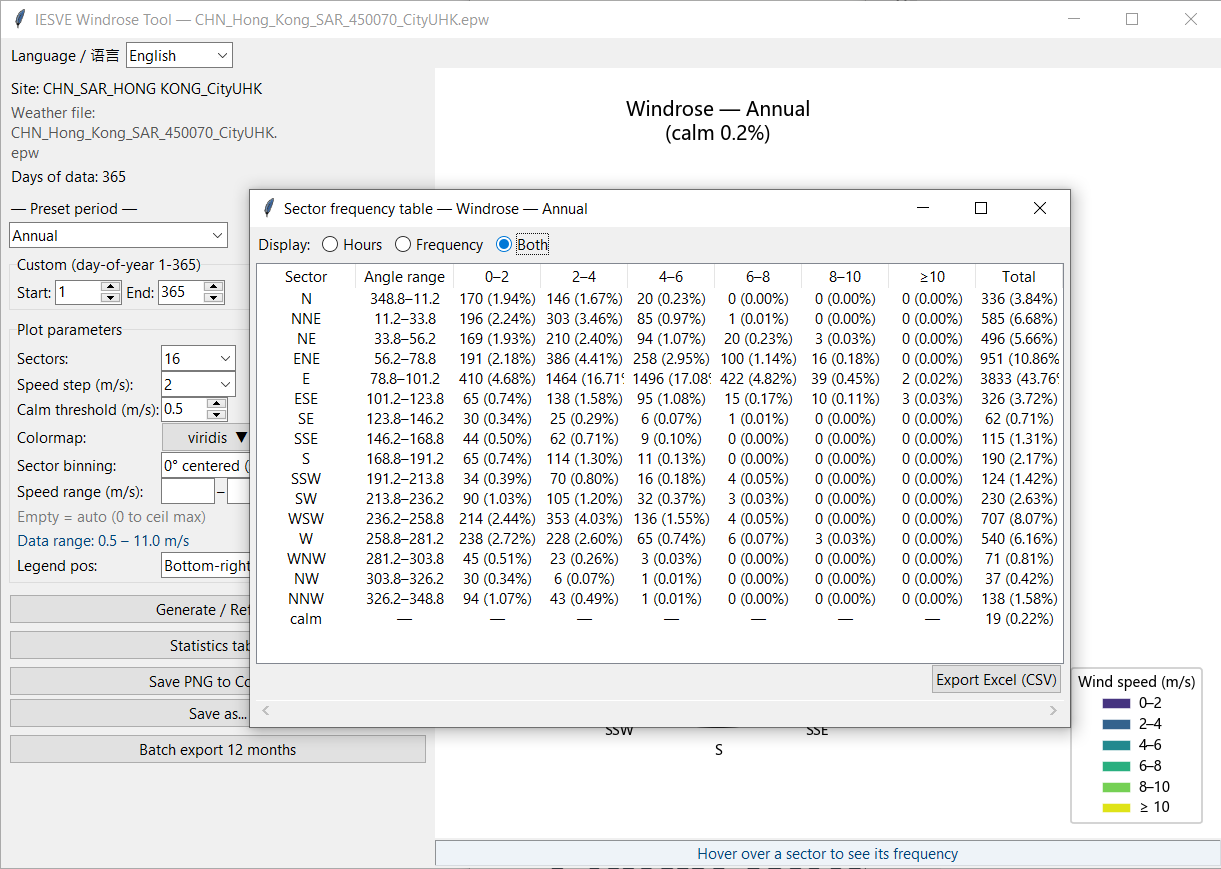
02 · CHECK
Inspect sector-frequency statistics
Review direction and speed-band statistics as hours, frequency or both, then export CSV data for Excel or further processing.
03 · EXPORT
Export a full 12-month chart set
This sample PDF shows one page of 12 monthly wind roses for the Hong Kong CityUHK weather file. It supports comparing monthly wind conditions and adding a clear appendix to a report.
Open the PDF in a new windowWHERE IT FITS
From early study to report graphics, a wind rose is the starting point for climate discussion.
Early wind-environment study
Before CFD or deeper wind-environment analysis, quickly identify the site's dominant directions and wind-speed distribution.
Natural-ventilation strategy
Turn seasonal or annual wind conditions into a readable chart to inform openings, airflow paths and strategy discussions.
Ratings and performance reports
Use it in weather-analysis sections for LEED, BREEAM and green-building reports, as well as presentations and academic papers.
US$5 · EMAIL TO INQUIRE
Confirm your IESVE release, then obtain the matching wind rose tool.
In your email, include your IESVE year, country or region, and the weather-data or project context you plan to use. Compatibility and delivery are confirmed first.